Cat-Friendly Home Statistics 2026: 51 Research-Backed Facts
This page collects published statistics about indoor cats, multi-cat households, litter boxes, feeding, enrichment, and cat-friendly home design. Every figure links to its original study or official dataset.
Last reviewed: September 12, 2026. Figures from different countries and surveys are shown separately and are not combined into a global estimate.
Key takeaways
- Multi-cat households make up a substantial share of the UK and Australian survey samples.
- Indoor-only living is common, but the rate varies by country, location, and survey design.
- Many homes provide elevated furniture, window access, scratching surfaces, toys, and private resting places.
- Shared food and water resources remain common in multi-cat homes.
- Litter-tray provision and cleaning routines differ widely between households.
- A meaningful share of surveyed homes provide fewer litter trays than cats.
- Odor control is a leading reason caregivers choose a litter product.
- Furniture scratching is frequently reported even when scratching posts are available.
- Interactive feeding tools remain uncommon compared with bowls and plates.
- Veterinarians are a major source of feeding advice, but fewer caregivers report receiving toileting advice.
- Urban and non-urban cat ownership patterns differ in Canadian household data.
- These figures describe specific survey samples and should not be pooled into a single global estimate.
How this page was built
We selected primary surveys and official statistics with clearly stated samples. We preserved each source’s population and wording, linked every number to its source, and avoided treating associations as causes. Percentages may not total exactly 100 because of rounding, skipped responses, or the source’s category definitions.
How common are multi-cat and indoor-only homes?
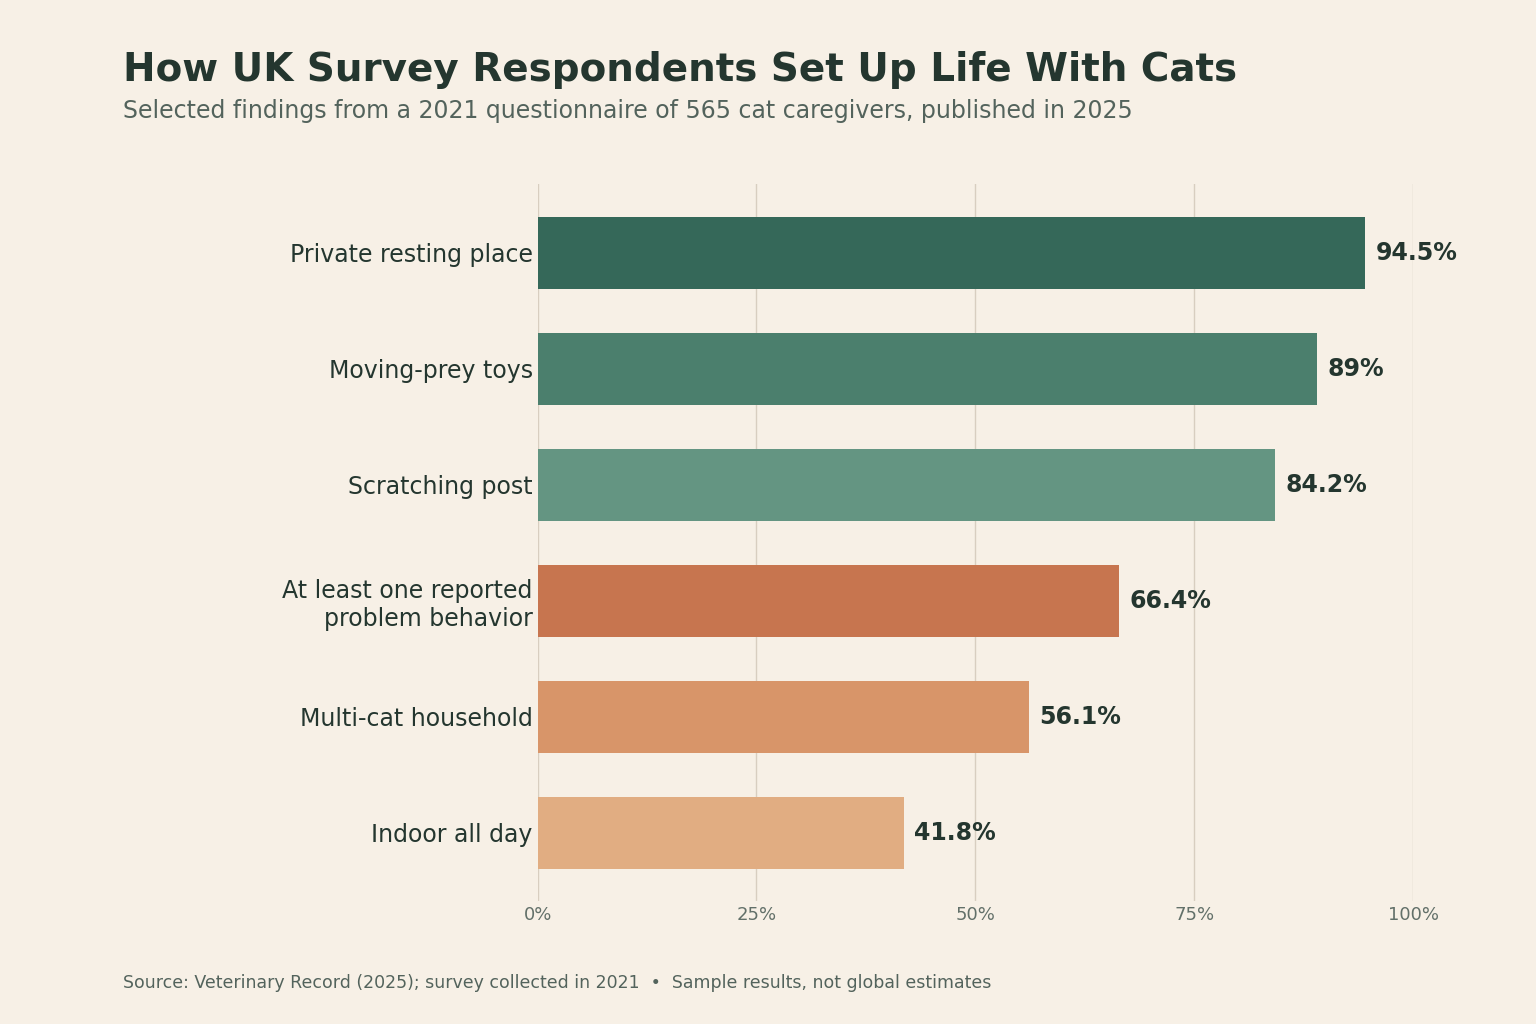
- 56.1% of respondents lived with more than one cat. Source: Veterinary Record / PMC, UK caregiver survey (collected 2021; published 2025).
- 43.9% of respondents lived with one cat. Source: Veterinary Record / PMC, UK caregiver survey (collected 2021; published 2025).
- Among multi-cat respondents, 63.7% lived with two cats. Source: Veterinary Record / PMC, UK caregiver survey (collected 2021; published 2025).
- Among multi-cat respondents, 17.0% lived with three cats. Source: Veterinary Record / PMC, UK caregiver survey (collected 2021; published 2025).
- Among multi-cat respondents, 9.8% lived with five or more cats. Source: Veterinary Record / PMC, UK caregiver survey (collected 2021; published 2025).
- 41.8% of the surveyed cats were kept indoors all day. Source: Veterinary Record / PMC, UK caregiver survey (collected 2021; published 2025).
- 58.2% of the surveyed cats had some outdoor access. Source: Veterinary Record / PMC, UK caregiver survey (collected 2021; published 2025).
- Among cats with outdoor access, 37.4% still spent 19–20 hours per day indoors. Source: Veterinary Record / PMC, UK caregiver survey (collected 2021; published 2025).
How are food and water resources arranged?
- 78.6% of multi-cat respondents provided separate food bowls. Source: Veterinary Record / PMC, UK caregiver survey (collected 2021; published 2025).
- 19.9% of multi-cat respondents said their cats shared a food bowl. Source: Veterinary Record / PMC, UK caregiver survey (collected 2021; published 2025).
- 78.4% of respondents provided water in a bowl. Source: Veterinary Record / PMC, UK caregiver survey (collected 2021; published 2025).
- 19.1% provided a water fountain. Source: Veterinary Record / PMC, UK caregiver survey (collected 2021; published 2025).
- 69.4% of multi-cat respondents said their cats shared a water bowl. Source: Veterinary Record / PMC, UK caregiver survey (collected 2021; published 2025).
- 69.6% said food and water were placed with at least some privacy. Source: Veterinary Record / PMC, UK caregiver survey (collected 2021; published 2025).
- 62.1% placed food or water in the kitchen. Source: Veterinary Record / PMC, UK caregiver survey (collected 2021; published 2025).
- 30.4% kept food or water within 50 centimetres of household machinery. Source: Veterinary Record / PMC, UK caregiver survey (collected 2021; published 2025).
How many homes provide litter trays?
- 81.8% of UK respondents provided one or more litter trays. Source: Veterinary Record / PMC, UK caregiver survey (collected 2021; published 2025).
- Among the 462 respondents who provided trays, 48.3% reported covered trays. Source: Veterinary Record / PMC, UK caregiver survey (collected 2021; published 2025).
- Among the 462 respondents who provided trays, 46.5% reported open trays. Source: Veterinary Record / PMC, UK caregiver survey (collected 2021; published 2025).
- Among respondents providing trays, 27.1% had fewer trays than cats. Source: Veterinary Record / PMC, UK caregiver survey (collected 2021; published 2025).
- Among respondents providing trays, 16.9% had more trays than cats. Source: Veterinary Record / PMC, UK caregiver survey (collected 2021; published 2025).
- Among respondents answering the litter-choice question, 42.9% selected odor control as the primary reason. Source: Veterinary Record / PMC, UK caregiver survey (collected 2021; published 2025).
- Among respondents providing trays, 45.5% removed waste multiple times per day. Source: Veterinary Record / PMC, UK caregiver survey (collected 2021; published 2025).
- Among respondents providing trays, 34.6% removed waste once per day. Source: Veterinary Record / PMC, UK caregiver survey (collected 2021; published 2025).
- Among respondents providing trays, 42.6% completely emptied and washed trays weekly. Source: Veterinary Record / PMC, UK caregiver survey (collected 2021; published 2025).
- Among respondents providing trays, 16.0% kept a tray within 50 centimetres of household machinery. Source: Veterinary Record / PMC, UK caregiver survey (collected 2021; published 2025).
What enrichment and resting resources are available?
- 94.5% said their cat had access to a private resting location. Source: Veterinary Record / PMC, UK caregiver survey (collected 2021; published 2025).
- 89.0% provided toys that mimic moving prey. Source: Veterinary Record / PMC, UK caregiver survey (collected 2021; published 2025).
- 84.2% provided a scratching post. Source: Veterinary Record / PMC, UK caregiver survey (collected 2021; published 2025).
- 60.4% provided a cat basket. Source: Veterinary Record / PMC, UK caregiver survey (collected 2021; published 2025).
- 55.2% provided a cat tower. Source: Veterinary Record / PMC, UK caregiver survey (collected 2021; published 2025).
- 55.5% of respondents with toys did not rotate them weekly. Source: Veterinary Record / PMC, UK caregiver survey (collected 2021; published 2025).
- 43.4% played with their cat for at least 30 minutes per day. Source: Veterinary Record / PMC, UK caregiver survey (collected 2021; published 2025).
- 72.2% petted their cat for more than 30 minutes per day. Source: Veterinary Record / PMC, UK caregiver survey (collected 2021; published 2025).
Which household behaviors are reported most often?
- Among all 565 UK respondents, 66.4% reported at least one behavior they considered problematic. Source: Veterinary Record / PMC, UK caregiver survey (collected 2021; published 2025).
- Among those 371 behavior-question respondents, 56.6% reported furniture scratching. Source: Veterinary Record / PMC, UK caregiver survey (collected 2021; published 2025).
- Among those 371 behavior-question respondents, 29.7% reported excessive vocalization. Source: Veterinary Record / PMC, UK caregiver survey (collected 2021; published 2025).
- Among those 371 behavior-question respondents, 23.2% reported hissing or growling. Source: Veterinary Record / PMC, UK caregiver survey (collected 2021; published 2025).
- Among those 371 behavior-question respondents, 18.9% reported urination outside the litter tray. Source: Veterinary Record / PMC, UK caregiver survey (collected 2021; published 2025).
What did the large Australian household survey find?
- The Australian survey covered 12,010 households and 23,920 cats. Source: Journal of Feline Medicine and Surgery / PMC, Australian household survey (collected 2017; published 2020).
- 54.5% of surveyed Australian households were multi-cat homes. Source: Journal of Feline Medicine and Surgery / PMC, Australian household survey (collected 2017; published 2020).
- 46.3% of surveyed households classified their cats as indoor-only; the study's definition allowed supervised harness outings and enclosed outdoor access. Source: Journal of Feline Medicine and Surgery / PMC, Australian household survey (collected 2017; published 2020).
- 81.2% of households provided high furniture that cats could access. Source: Journal of Feline Medicine and Surgery / PMC, Australian household survey (collected 2017; published 2020).
- 64.2% provided a cat tower or cat tree. Source: Journal of Feline Medicine and Surgery / PMC, Australian household survey (collected 2017; published 2020).
- 92.4% of indoor-cat households provided a scratching post. Source: Journal of Feline Medicine and Surgery / PMC, Australian household survey (collected 2017; published 2020).
- 7.3% used an interactive food puzzle as the main feeding method. Source: Journal of Feline Medicine and Surgery / PMC, Australian household survey (collected 2017; published 2020).
- 60.5% said the tray was larger than their largest cat. Source: Journal of Feline Medicine and Surgery / PMC, Australian household survey (collected 2017; published 2020).
How common is cat ownership in Canada?
- 21% of Canadian households owned at least one cat in 2023. Source: Statistics Canada, Households and the Environment Survey (2023 data).
- 12% of Canadian households owned one cat. Source: Statistics Canada, Households and the Environment Survey (2023 data).
- 7% owned two cats. Source: Statistics Canada, Households and the Environment Survey (2023 data).
- Cat ownership was reported by 19% of households in census metropolitan areas and 29% outside them. Source: Statistics Canada, Households and the Environment Survey (2023 data).
Primary sources
- UK caregiver survey (collected 2021; published 2025) — Questionnaire-based study of 565 UK cat caregivers.
- Australian household survey (collected 2017; published 2020) — Survey of 12,010 households covering 23,920 cats.
- Households and the Environment Survey (2023 data) — Official Canadian household estimates.
How to cite this page
Suggested citation: Purr & Perch Editorial. “Cat-Friendly Home Statistics 2026: 51 Research-Backed Facts.” Last reviewed September 12, 2026.
Editors and researchers may quote individual figures with a link to this page and the original source. For corrections or source updates, use our contact page.